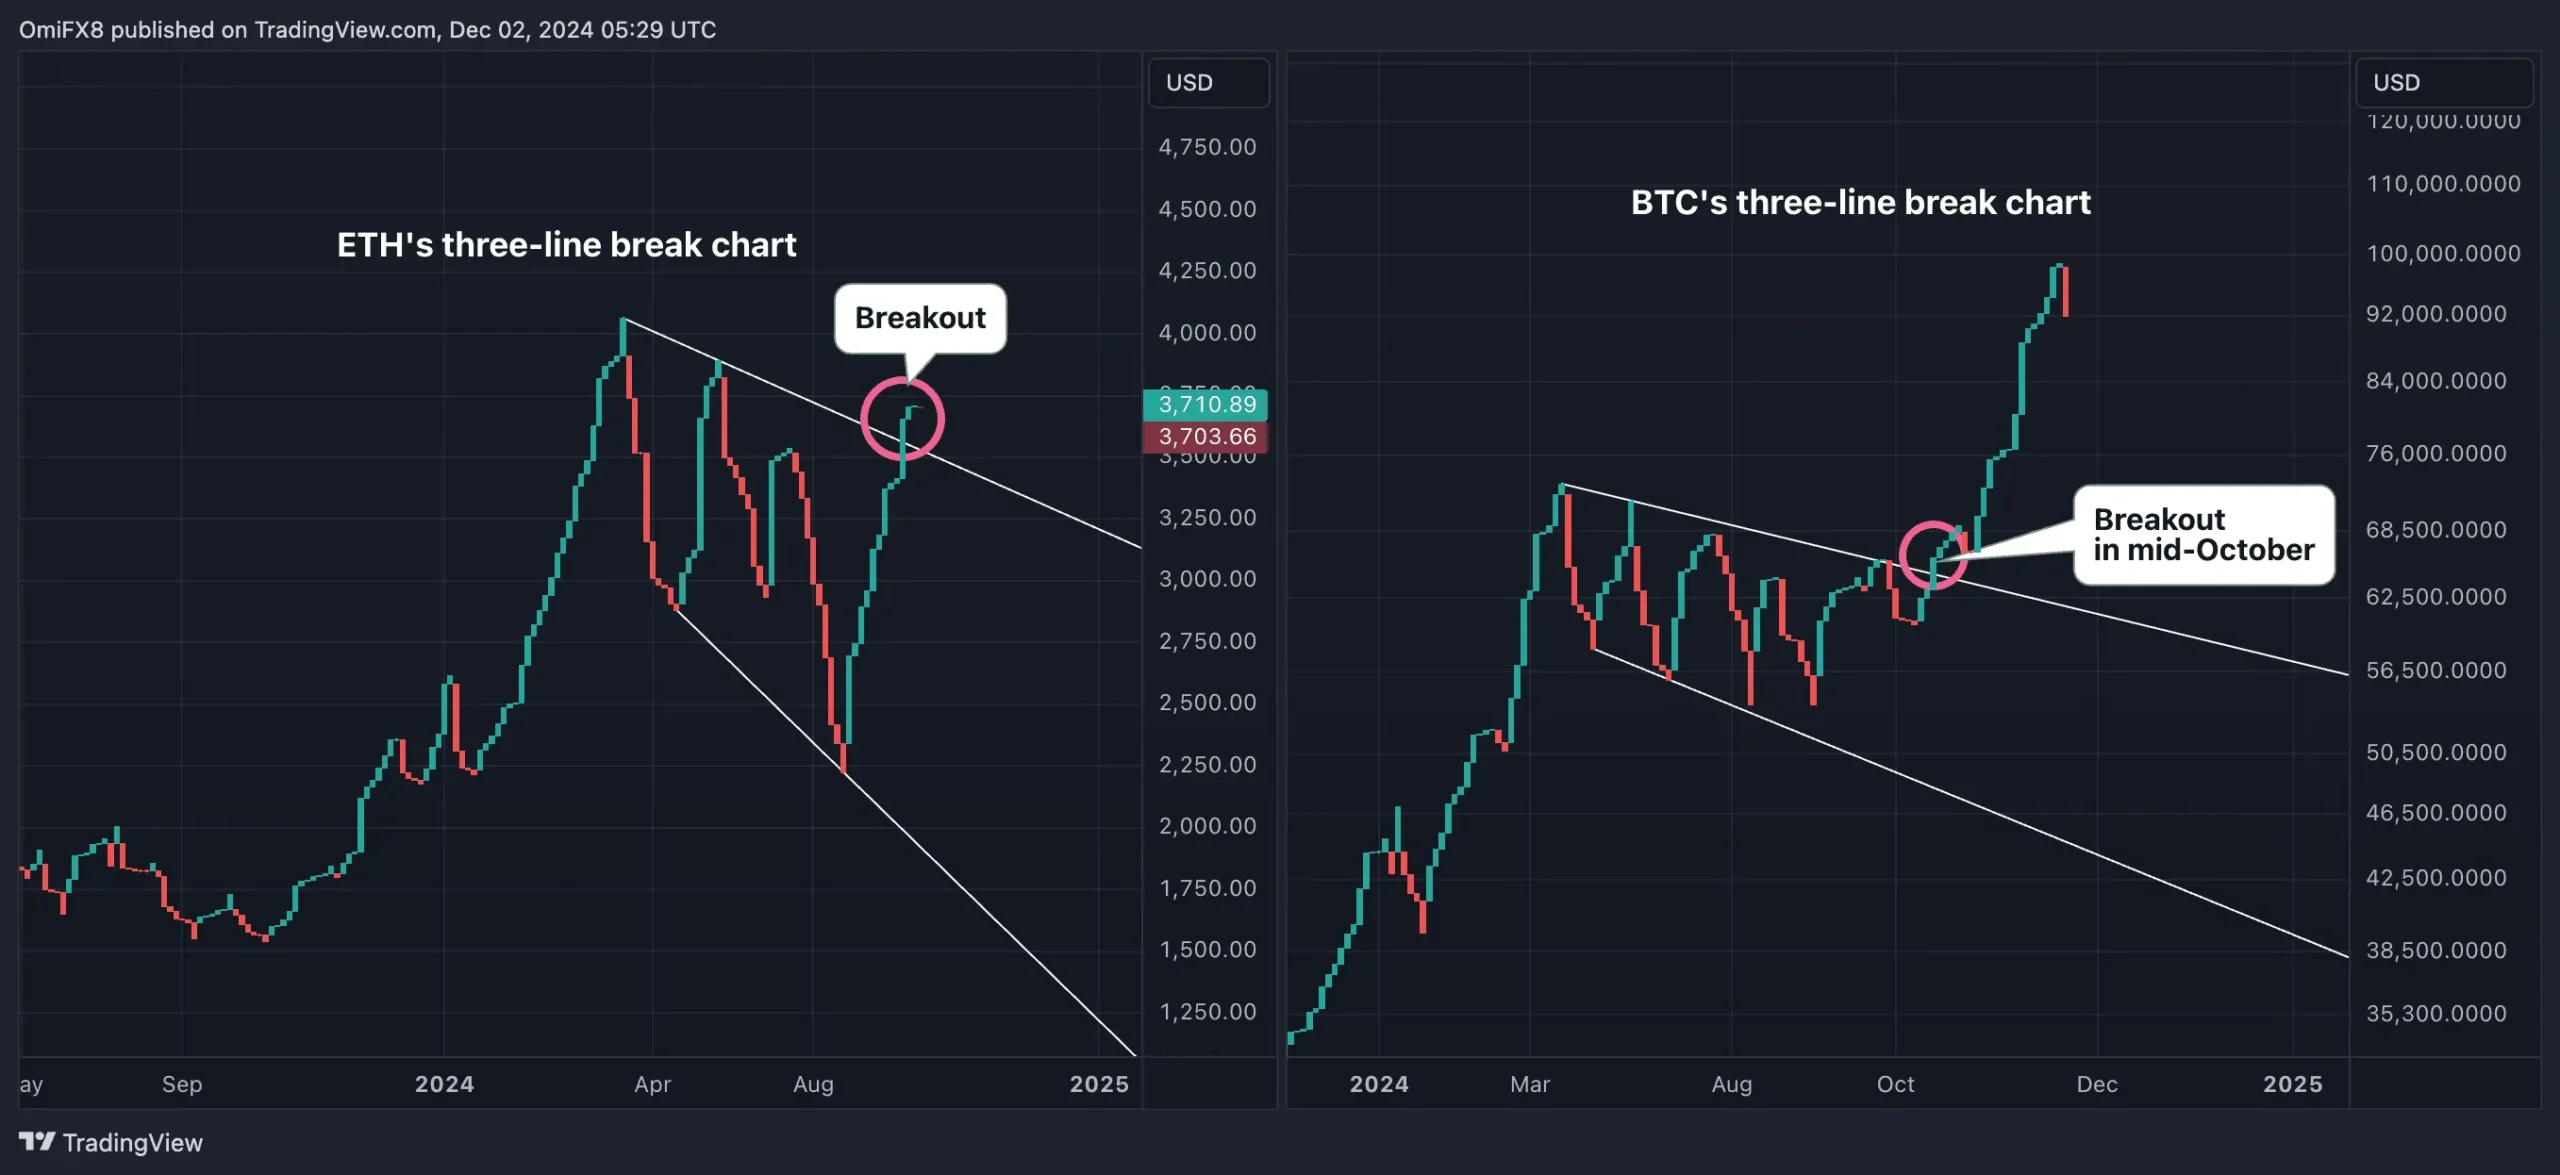
Ethereum’s native token, ether (ETH), is showing a promising bullish chart pattern that resembles a signal seen in Bitcoin (BTC) before its historic price surge. Combined with rising network activity and record ETF inflows, Ethereum is setting the stage for potential upward momentum.
A Bullish Breakout: Ether’s Three-Line Break Chart
Ether’s three-line break chart, a technical analysis tool that filters out daily price volatility, reveals a major shift in trend. After an eight-month correction characterized by lower highs and lows, ETH has resumed its broader uptrend from the October 2023 lows near $1,500.
- Such breakouts often create a bullish cascading effect: new buyers enter the market while sellers, who capped gains during consolidation, are forced to retreat.
- Bitcoin (BTC) displayed a similar breakout in mid-October, which signaled its rally to record highs above $73,000. BTC has since surged by 45%, crossing $96,000.
While technical patterns like this offer valuable signals, it’s important to note that fundamental factors can heavily influence price action, sometimes overriding chart predictions.
Ethereum Network Activity Strengthens the Bullish Outlook
The Ethereum network is experiencing a notable uptick in activity, further supporting ETH’s bullish setup. Key developments include:
1. Surge in Layer-2 Network “Blobs”
The number of “blobs” posted by Ethereum’s layer-2 protocols saw a sharp rise in November. Blobs are data packets that incur transaction fees paid in ETH. These fees, like regular network charges, are burned—reducing the overall supply of ether.
- This supply burn mechanism helps tighten ETH’s availability, potentially driving its price upward as demand grows.
2. Record ETF Inflows Signal Rising Investor Interest
Mainstream interest in Ethereum is also surging, evident in the growing inflows into spot-based ether ETFs. On Friday, U.S.-listed spot ETH ETFs recorded a total of $332.9 million in inflows—the highest daily tally since their launch, according to data from Farside Investors.
This influx of institutional capital underscores investor confidence in Ethereum’s long-term potential.
The Bitcoin Parallel: What This Means for ETH
The similarities between Bitcoin’s mid-October breakout and Ether’s current chart pattern have caught traders’ attention. When BTC broke out of its prolonged downtrend, it quickly gained momentum, pushing prices to record highs.
Ether now finds itself in a similar position:
- A confirmed bullish breakout could attract fresh buyers and amplify demand.
- Rising Ethereum network activity, coupled with strong ETF inflows, further supports this positive price outlook.
Ether Positioned for a Strong Rally
Ethereum’s combination of technical strength and fundamental growth is painting a bullish picture for ETH. The breakout on its three-line break chart, rising layer-2 activity, and record ETF inflows provide multiple signals of renewed momentum.

With Ethereum now mirroring a pattern that drove Bitcoin to historic highs, investors are watching closely for ETH’s next move. If these trends hold, Ethereum could be on the verge of a significant price surge, reinforcing its status as a leading force in the cryptocurrency market.

